Blog
Back

Dec 01 2023
Black Week 2023
Black Week has come to an end! Here are some highlights from this year's busiest shopping period.
Higher spend and higher volumes
Our data shows that spending during this year's Black Week surpassed that of the previous year. Upon examining e-commerce advertisers across 12 European markets, we found that the total e-commerce order value grew by 30 %, while the average order value (AOV) during Black Week experienced a 12 % rise from 2022.
Commonly, one might anticipate a decline in sales volume during periods of economic instability. In contrast, the sales volumes for the same group of advertisers increased by 16 % year-on-year.
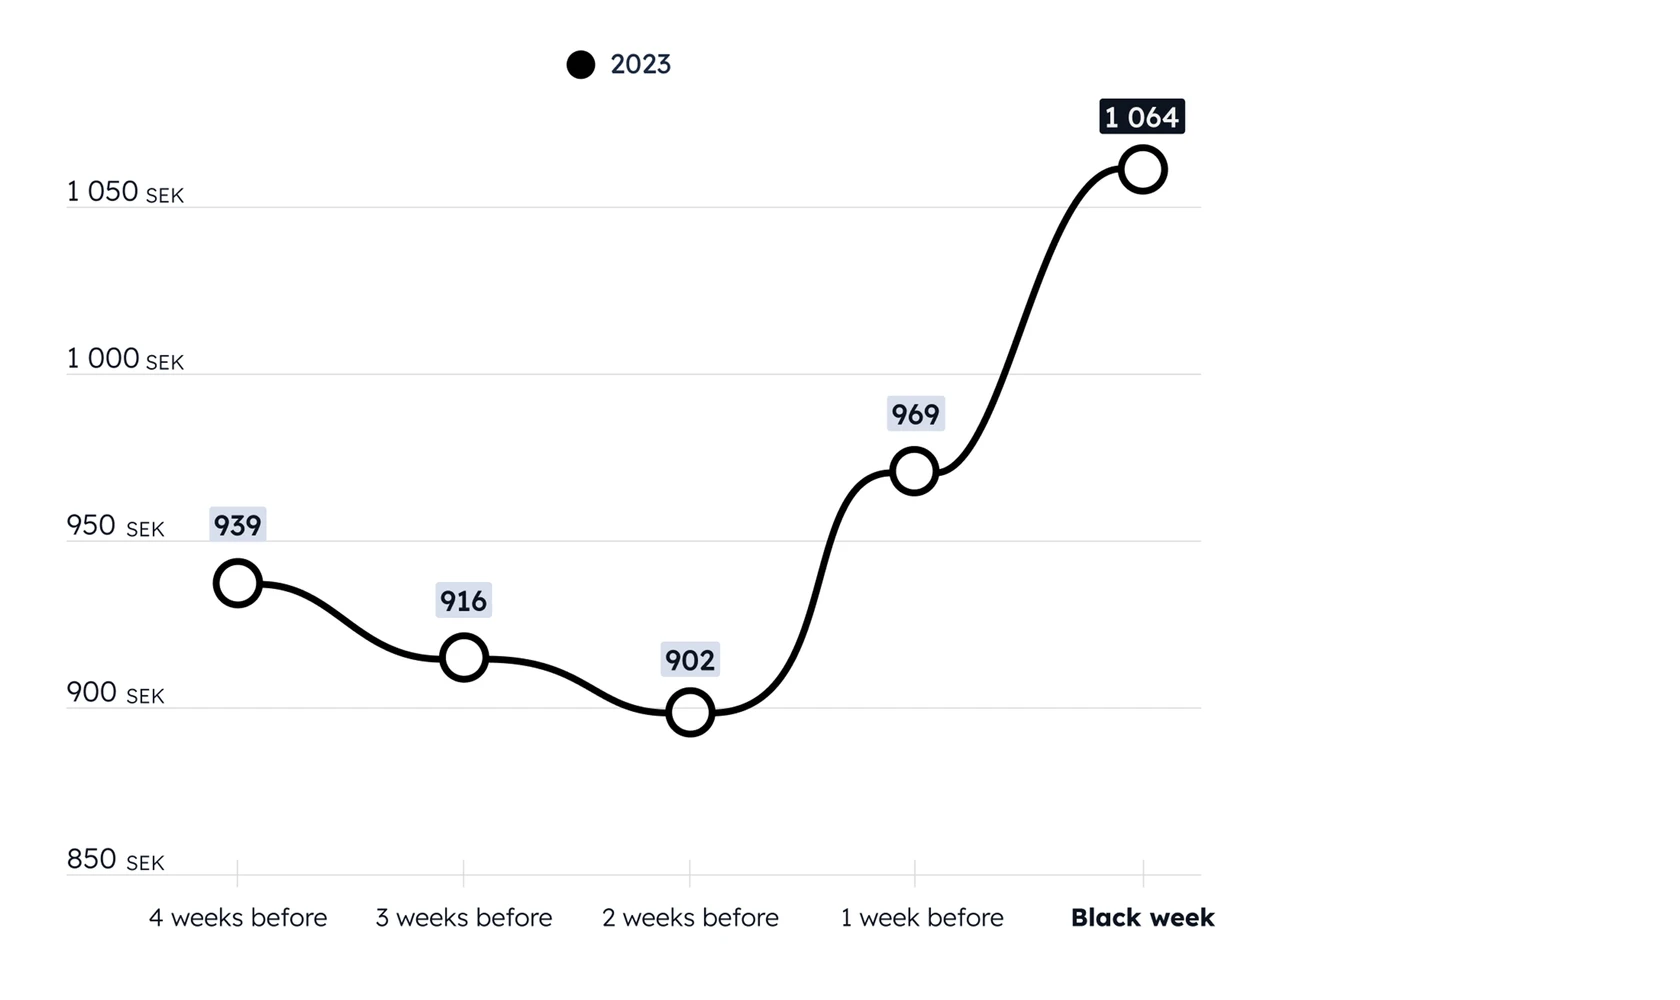
In recent years, there has been a gradual decline in AOV as we approach Black Week, with shoppers anticipating the beginning of the sales event. However, this year has seen a shift from the usual pattern, with AOV starting to climb in the week before Black Week and achieving its highest level during Black Week itself. The rise in AOV during this lead-up week reinforces the notion that Black Week is becoming an extended event for both brands and consumers.
Black Week development
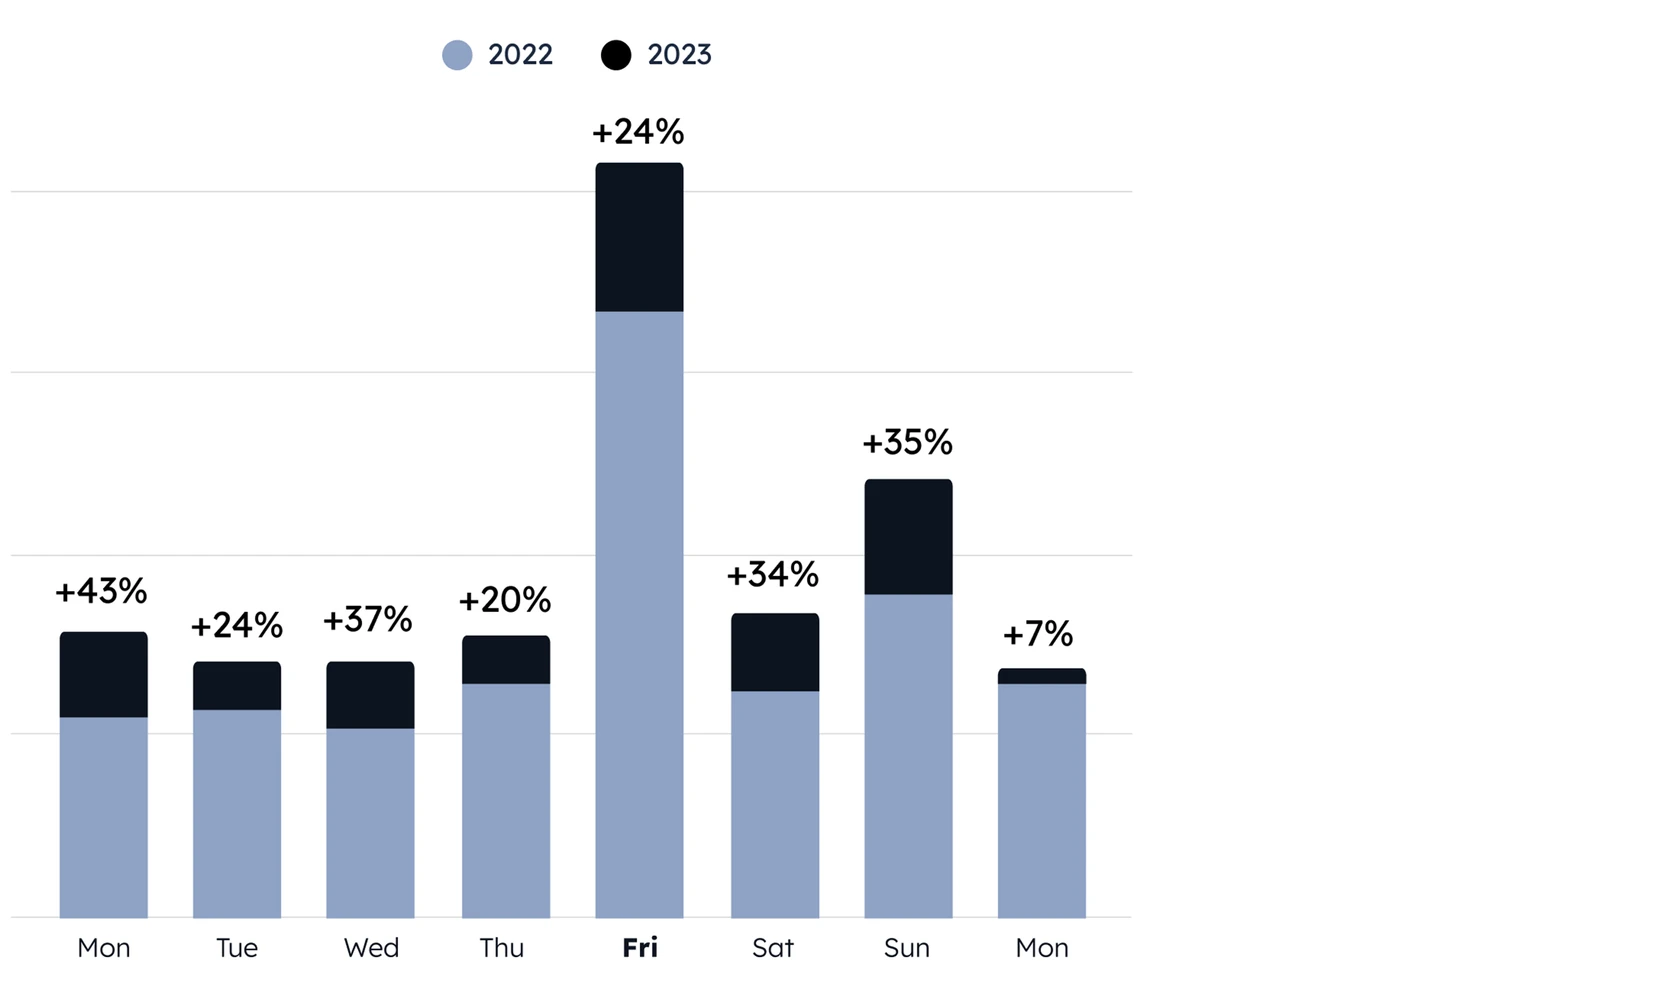
An analysis of the growth in order values from 2022 to 2023 reveals that the early days of the week saw the most significant growth.
Monday saw a 43 % increase in order value compared to Monday last year, while Wednesday reached a 37 % increase. Even the busiest Black Week day, Friday saw a 24 % increase. The weekend, however, witnessed larger gains, with order values climbing by 34 % on Saturday and 35 % on Sunday. In contrast, Cyber Monday experienced a modest 7 % increase.
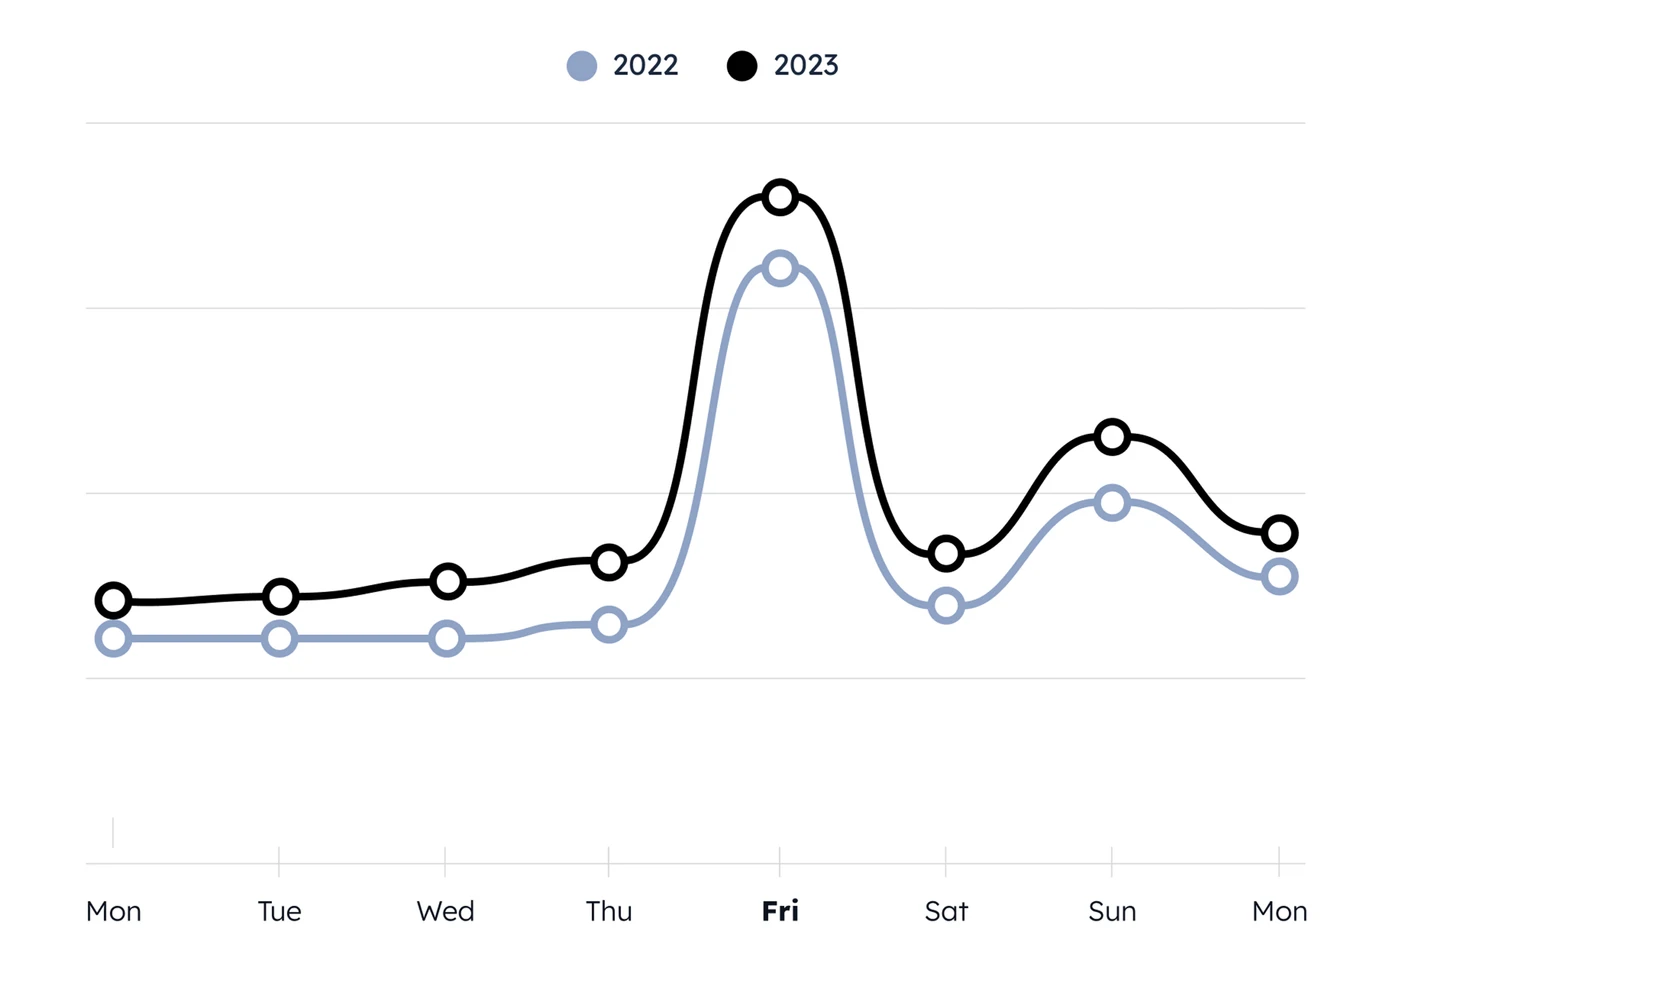
The rising significance of weekdays, particularly early in the week, is evident when examining the sales volume during Black Week. In 2022, Black Friday accounted for 24.55% of the total week’s volume, and the share decreased to 23.69% in 2023. This trend is apparent throughout the rest of the week, with a greater portion of spending observed both early in the week and during the weekend. Sunday, the second-largest day in terms of volume, accounted for 15.20 % of total sales in 2023, compared to 14.87 % in 2022.
The trend of extending Black Friday deals over a longer period isn't entirely new. Phrases such as "Black Weeks," "Black Month," and "Cyber Week" have gained popularity, emphasising the prolonged sales period. Moreover, the significant uptick in sales earlier in the week suggests that consumers are increasingly favouring a more relaxed, spread-out shopping experience over the frenzied one-day spree.
Trending categories
When examining advertiser categories, we observe that sales volumes within the beauty category and the fashion categories increased by 23 % and 21 %, respectively. Kids and family experienced a high 51 % growth, while electronics saw an 19 % rise year-on-year. Meanwhile, the interior category saw a more modest 12 % increase.
Slower shopping
Contrary to the widespread belief that shopping activity accelerates during Black Week, our data shows an unexpected tendency for shopping to slow down during this period. By reviewing click-to-conversion times across our diverse range of partners, we see a notable increase in the duration of the shopping process. Across all markets and e-commerce partners, the median click-to-conversion time increases by more than 50 % during Black Week compared to the weeks before.
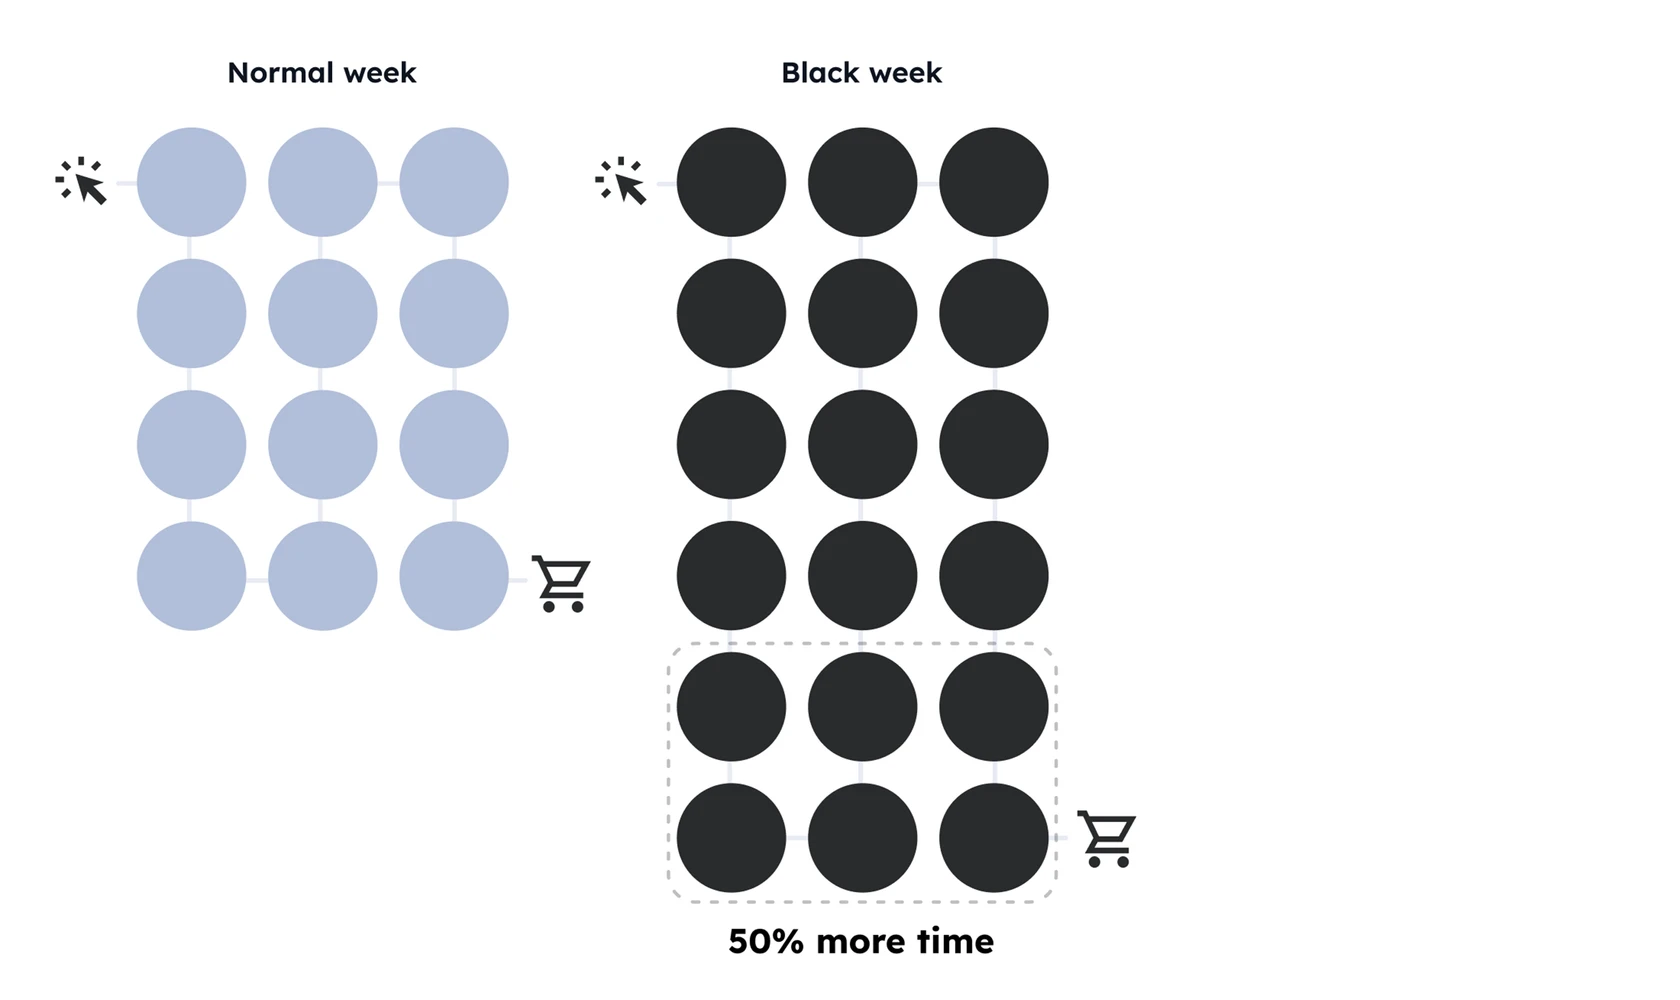
This suggests that the shopping experience during this year's Black Week involved either more deliberate and careful decision-making by customers or that consumers were on the lookout for even better deals.
Partner types
During Black Week, the five primary drivers of sales volume were content websites, cashback platforms, directory sites, portals, and Google Shopping partners. Each of these types of partners accounted for a considerable share of the overall volume.
16 % of completed sales come from content sites, and 14 % originate from cashback and reward sites. Directory sites account for 14 % of conversions, while portals and Google Shopping partners constitute 11 % and 10 %, respectively.
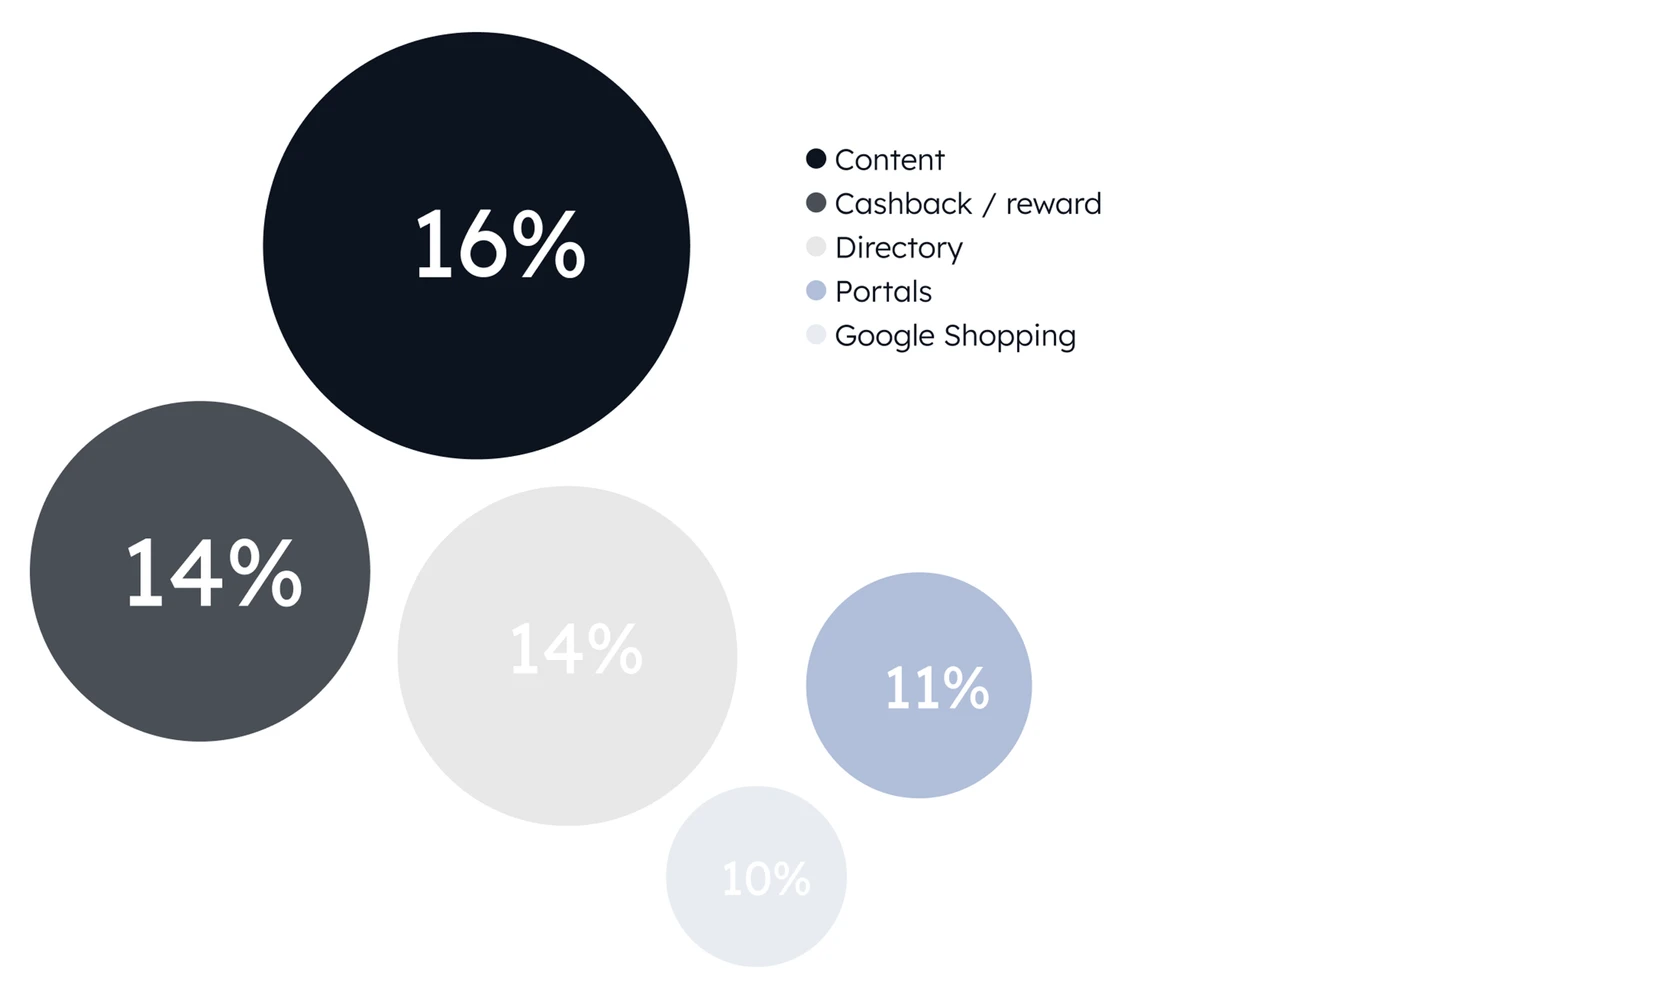
Although there was a 6 % drop in the share of cashback/reward contributions to sales volume from 2022 to 2023, a significant portion of sales, 14 %, still came from this partner type during Black Week. This indicates that customers consistently seek cashback options and emphasises the importance for e-commerce brands to be present on these platforms to access a broad audience.
Conclusion
Black Week has been a success for many of Adtraction’s e-commerce retailers, despite uncertainty as to how the event would turn out this year.
We’ve observed an increase not only in OV and AOV, but also in the total number of sales when examining data from Adtraction’s e-commerce advertisers across 12 European markets. Additionally, sales distribution was more even, with Black Friday contributing to 23.69 % of the week's total sales volume during Black Week.
The trend of extending Black Friday into a longer event continues to evolve, and it will be interesting to observe in the coming years how concepts such as Black Week, Black Month, and Cyber Week will develop.
About the data
For this study we have examined data from all Adtraction's e-commerce programs across 12 European markets, comparing Black Week 2023 with the same period last year.